HOMER Case1 (For LCOH)
A standard system of a wind turbine, a PEM electrolyser and a hydrogen tank was fixed for all locations to assess if it is feasible to produce hydrogen at different locations.for Multiple locations selected based on the diesel consumption in Greenland, LCOH was compared for all locations and the 4 locations with the lowest values were selected. Hydrogen load was specified at 2000kg/day for all locations to assess the effect of average wind speed on the feasibility of producing Hydrogen.
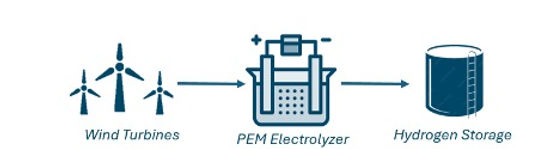
Figure 1: illustrating simulations for Case 1
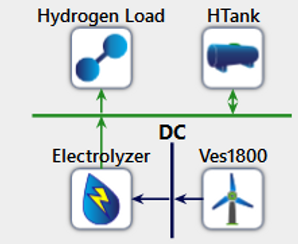
Figure 2: HOMER layout design for Case 1
HOMER Case 2 (For Feasibility)
A system configuration including a wind turbine, PEM electrolyser, hydrogen tank and hydrogen powered generator was used for the second case. This is our main system. This configuaration was done only for the four location that had the lowest LCOH to compare the different LCOE and NPC. The Electric load was scaled for each location based on the approximate diesel consumption for electricity. Electric Load was calculated based on the aproximate diesel consumption in Litres /day

Figure 3: illustrating simulations for Case 2

Figure 4: HOMER layout design for Case 2
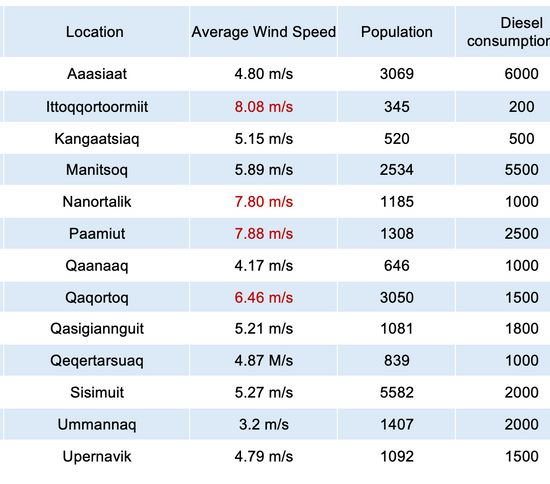
Table 1 below shows the list of the remote communities used in the simulations, the average wind speed in each area and the diesel consumption in each location.
Table 1: List of remote communities with their respective diesel consumption

HYDROGEN LOAD AND ELECTRIC LOAD CALCULATION
For Case 1;
The calculation of the hydrogen load was based on the daily diesel consumption. The graph indicated a peak consumption of 6000 l/day, which is kept constant for all locations.
Diesel consumption of 6000 l/day can be replaced by a hydrogen load of 2000 kg/day.
Calculation of hydrogen load from diesel consumption:
Conversion Factor:
Diesel Energy Content = 38.6 MJ/l
Hydrogen Energy Content = 120 MJ/kg
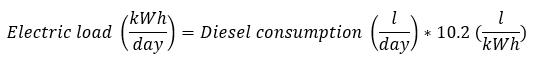
For Case 2;
The electric load was determined by the specific diesel consumption in each location. As diesel consumption varied across different areas, so did the corresponding electric load.
Calculation of electric load from diesel consumption:
Conversion Factor:
Diesel Energy Content - 10.2 l/kWh

Process Modelling
The Aspen Plus simulation environment depicted in Figure 5 showcases the intricate modeling of a Proton Exchange Membrane Electrolyzer (PEME) with its inherent components. PEME is a central component (Figure 6) vital for hydrogen production. Given the absence of a dedicated PEM electrolyzer model within the standard Aspen Plus unit operation library, the utilization of Aspen Custom Modeller became imperative. This bespoke approach necessitated a deep dive into programming languages and intricate correlations among various electrolyzer parameters. Through meticulous exploration and deliberation, an electrolyzer system was carefully modelled and seamlessly integrated into the Aspen Plus framework.

Figure 5: Aspen Plus Simulation environment of PEM Electrolyzer

Figure 6: Process Modelling of PEM Electrolyzer on Aspen Plus
Process Modelling (continued)
The electrolysis process unfolds with the introduction of freshwater feed at the anode (Figure 7), where water oxidation and the ensuing oxygen evolution reaction (OER) yield gaseous oxygen. A two-phase separator facilitates (Figure 9) the separation of oxygen gas from water before its exit from the system. Concurrently, the cathodic compartment (Figure 8) hosts the hydrogen reduction reaction (HRR), yielding gaseous hydrogen. An analogous two-phase separator (Figure 9) ensures efficient separation of water and hydrogen gas. Additionally, a specialized equipment unit, serving as a combined chiller and liquid-gas phase separator, was meticulously modeled. This equipment has a refrigerant utility which condenses entrapped water vapors escaping with the gaseous stream. Its separation compartment then facilitates the return of condensed water back to the system thereby ensuring high purity of final hydrogen stream (99.9%).
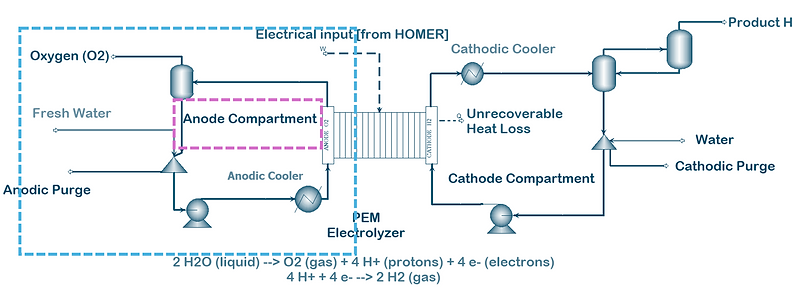
Figure 7: Anode Compartment of PEM Electrolyzer

Figure 8: Cathode Compartment of PEM Electrolyzer

Figure 9: Two Phase Separators on Anode and Cathode Compartments
Process Modelling (continued)
To maintain optimal operation of the PEME, anodic and cathodic coolers (Figure 10) are strategically employed to dissipate excess heat from the feedwater. These coolers, reliant on cooling water as their utility, play a pivotal role in determining the cooling water requirements essential for sustaining hydrogen yield. A comprehensive analysis of simulation outcomes, meticulously tabulated in Table 1, provides detailed insights into system performance. Purge removal mechanisms, operational at both the anodic and cathodic sections, ensure timely elimination of purge water as needed. The electrical power input to the PEME, derived from HOMER simulations, is seamlessly integrated into the Aspen simulation environment to compute the corresponding hydrogen production.

Figure 10: CW exchangers both on Anode and Cathode Side
Table 2: Comprehensive Stream results. For stream reference, please see Figure 1 on this page